

The Federal Reserve is quite interesting, with a hawkish dot plot, but the attitude in the Federal Reserve's statement is slightly dovish.
┈┈➤Hawkish Dot Plot
The Federal Reserve officials have the same probability for the interest rate expectations at the end of 2026 across three ranges.
These three ranges correspond to the rate cuts in 2026:
0.25% * 0 times
0.25% * 1 time
0.25% * 2 times
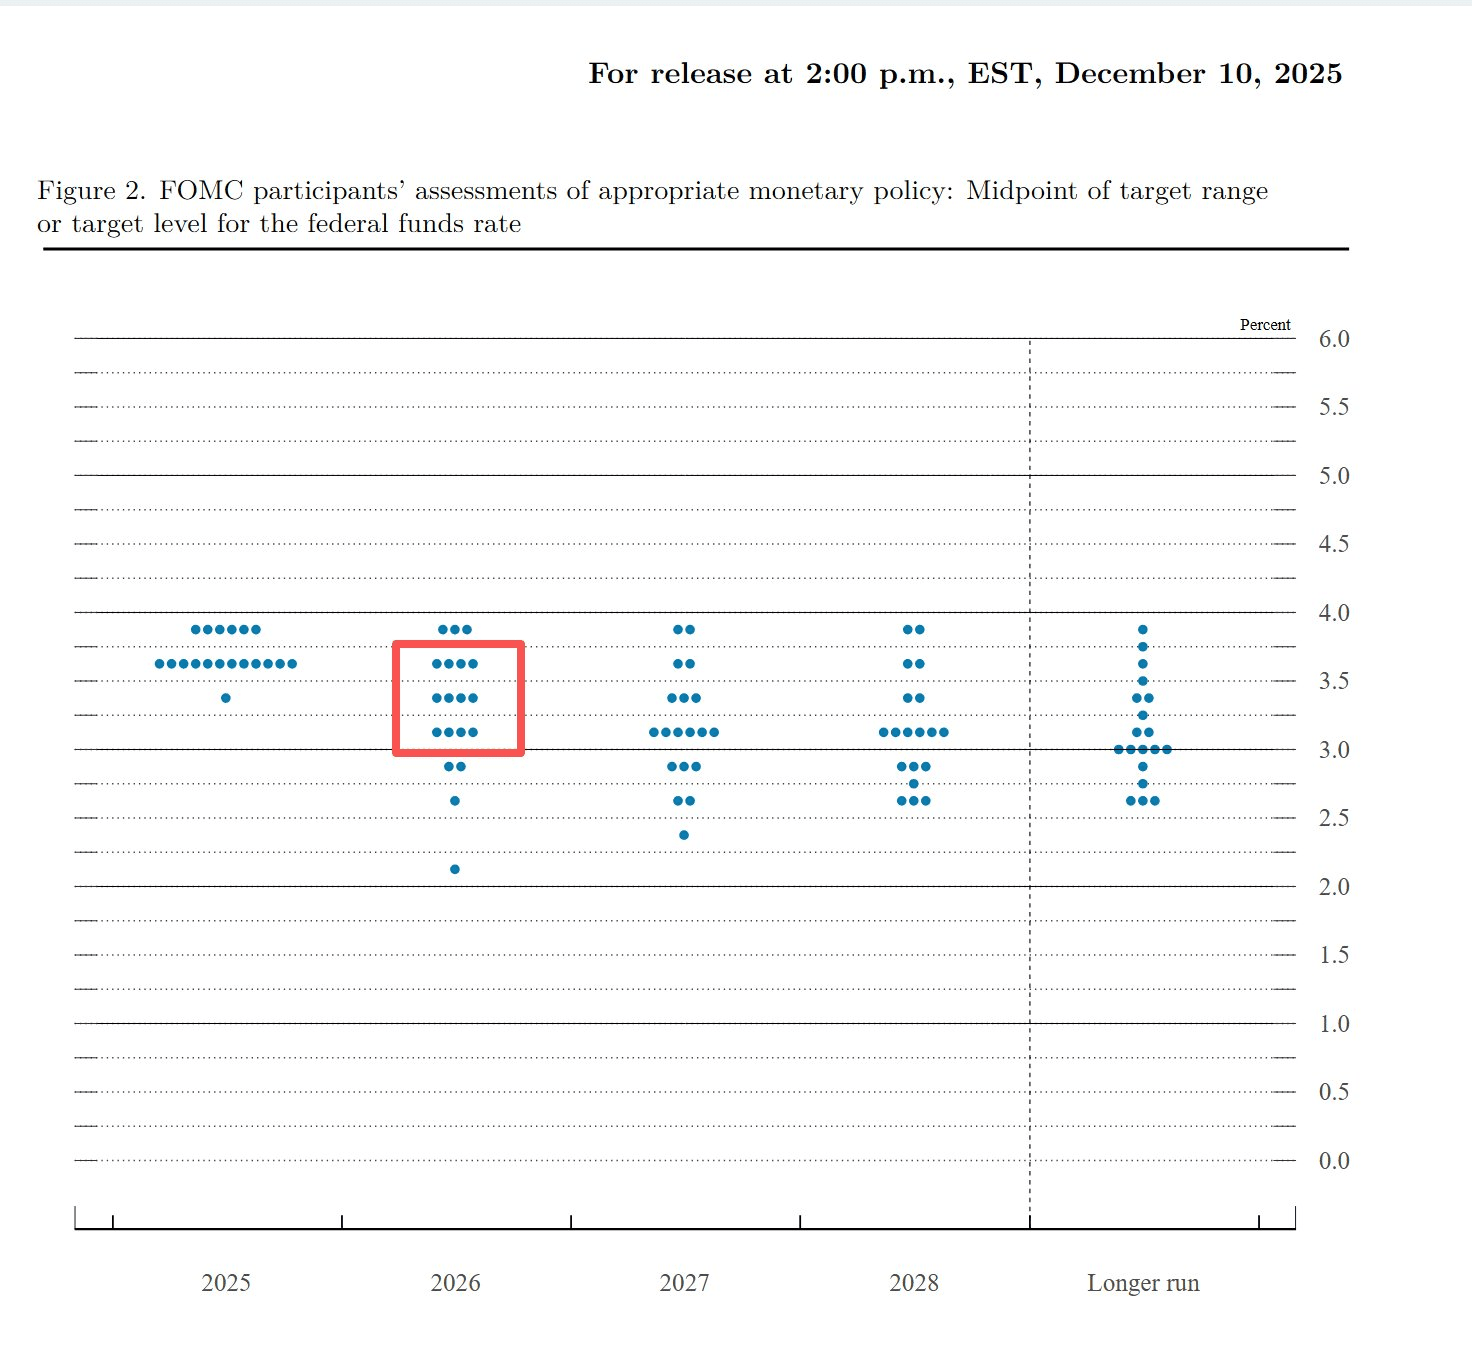
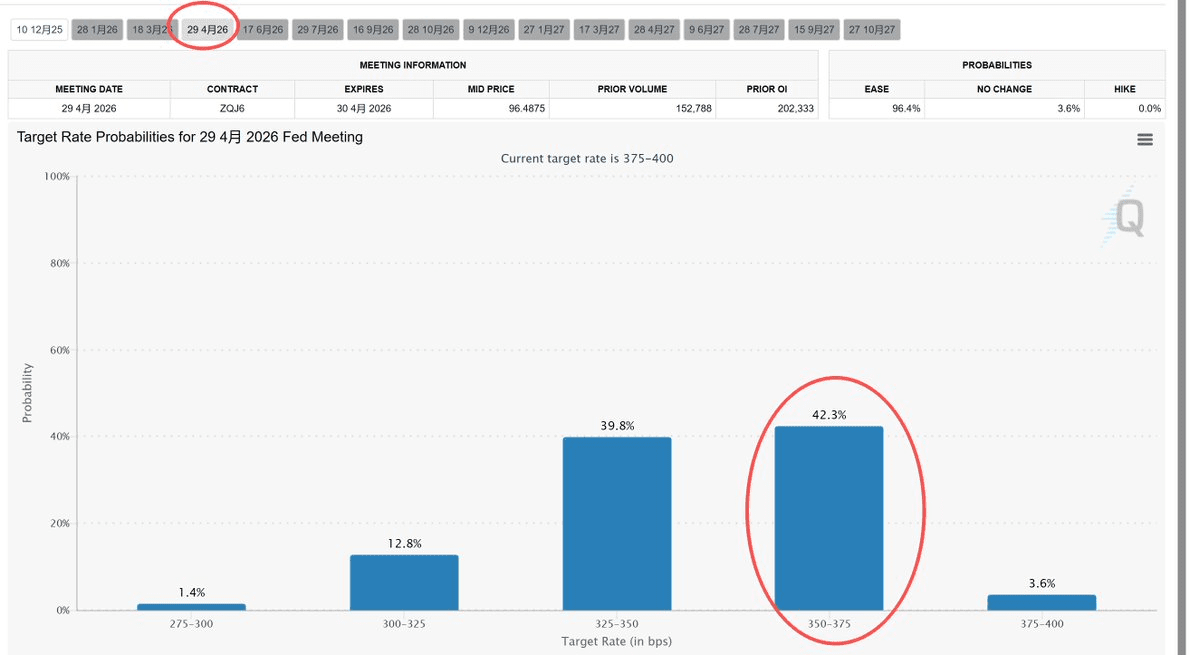
A rate cut of 0-2 times still leans hawkish. Previously, the CME interest rate futures indicated that the first rate cut in 2026 was expected in April and July, which means 2 times. However, the Federal Reserve's dot plot shows a maximum of 2 times, averaging 1 time, so the market's expectation for the first rate cut in 2026 has now changed to June.
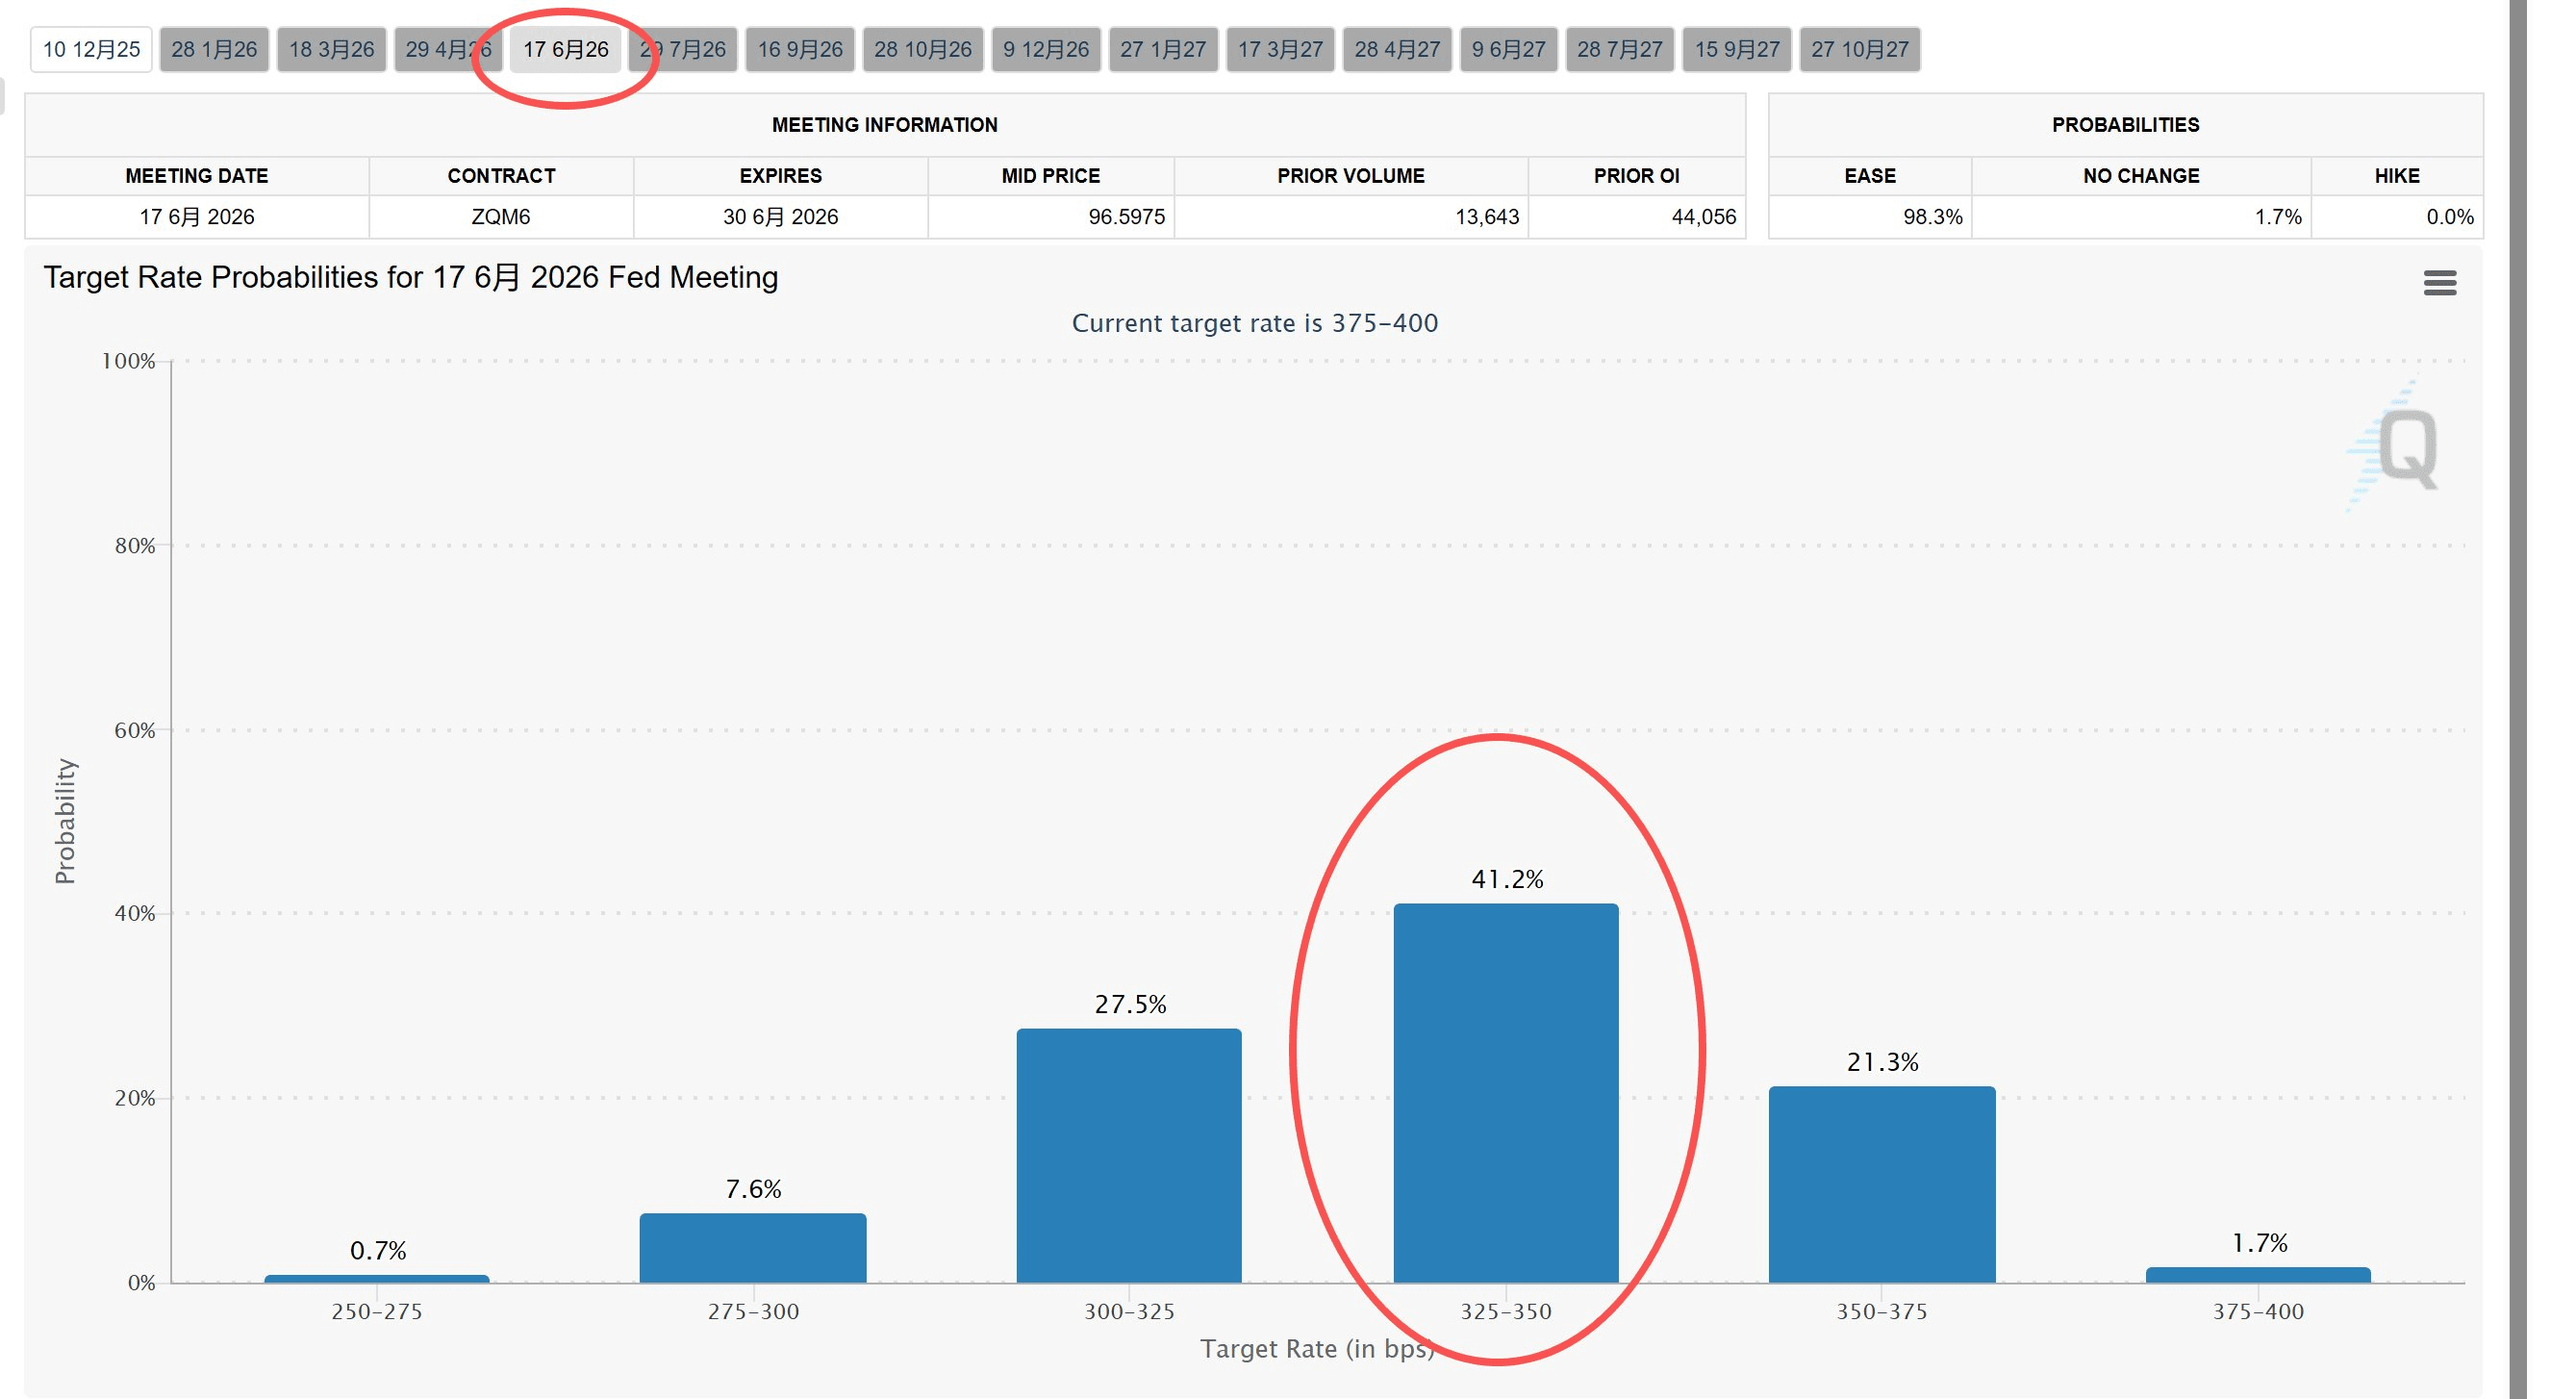
The expectation for April has turned into no rate cut.
┈┈➤Dovish Statement
The statement released by the Federal Reserve mainly includes the following contents:
First, "Economic activity is expanding at a moderate pace. So far this year, job growth has slowed, and the unemployment rate rose slightly in September. The inflation rate has increased since the beginning of the year and is still at a relatively high level."
Second, the Federal Reserve continues to emphasize its long-term goals of maximum employment and 2% inflation.
Third, the Federal Reserve cut rates by 25 basis points, citing its considerations as the economic outlook and supporting maximum employment.
Fourth, the Federal Reserve stated, "We will purchase short-term government bonds as needed."
▌The following is the analysis and interpretation:
The first two points mention the economy, employment, and inflation. However, they place the economy and employment before inflation, indicating that the Federal Reserve is clearly aware of the sluggishness in U.S. employment and the economy. (Bee Brother previously analyzed this issue with data from two articles; even a foreign rookie knows this, and the Federal Reserve cannot be unaware.)
In the third point, the Federal Reserve directly takes the economy and employment as prerequisites, proposing a 25 basis point rate cut in December.
In the fourth point, they are preparing to purchase short-term government bonds. It is not considered QE, but a form of accommodative monetary policy.
┈┈➤ Which is more, hawkish or dovish?
Although the Federal Reserve plays a good game of Tai Chi, we can still analyze some information from it:
Dovish slightly outweighs hawkish.
First, recent debt purchases dominate.
Because the Federal Reserve's statement indicated it would soon purchase short-term government bonds, this is not only a statement but also a recent action. The dot plot is a long-term forecast.
Clearly, short-term actions are more real, while long-term expectations still have uncertainties in the future.
In the first half of the year, there may be so-called changes based on economic, employment, and CPI data.
In the second half of the year, the Federal Reserve is likely to change leadership, so the dot plot's prediction for the entire year of 2026 has less significance.
Second, the dot plot actually has no results.
For three scenarios of a 0-50 basis point rate cut in 2026, the predicted number of people is exactly the same, so the Federal Reserve officials actually have no conclusion.
This is completely within expectations. After two rate cuts in September and October, there are no CPI data to refer to, making it impossible to determine whether CPI will rebound after the rate cut.
Third, the dot plot and the attitude expressed in the statement are slightly contradictory, which may be a form of expectation management.
The Federal Reserve clearly understands that its attitude and actions will affect market expectations. If debt purchases + dovish dot plot, it brings a market expectation that the U.S. economy is in recession.
On the contrary, the current hawkish forecast in the dot plot + dovish debt purchase behavior sends a signal to the market that the U.S. economy is not very optimistic at present, but it is not in recession.
▌The market has already reacted
The S&P 500 index jumped up in the daily line, and at 3 o'clock it showed a large bullish candle, rising 0.72% in one hour, and continued to rise by 4:20.
BTC and ETH reacted a bit slower, starting to rise at 4 o'clock. BTC surged to $94,200, currently temporarily retreating to around $93,333. ETH surged to $3,440, temporarily around $93,500.
┈┈➤In Conclusion
Of course, crypto friends and U.S. stock investors should not be overly optimistic.
Although U.S. Treasury bonds are about to start purchasing, talking about the efficacy without considering the dosage is also a form of deception.
It is uncertain how much liquidity the Federal Reserve can release through bond purchases.
If there is a small amount of accommodation, this does not align with the environment of a bull market, nor does it fit with a bear market.
Next, we need to continue to pay attention to the non-farm payroll data on December 16 (for November) and the CPI data on December 18 (for November). The non-farm payroll is likely to be disappointing because November is the later period of the U.S. government shutdown, which significantly affected the economy. Pay special attention to the CPI for November; if it does not rebound after the rate cuts in September and October, this reduces the obstacles for the Federal Reserve to implement further easing.

